Blind spots in production
Teams find out about issues from users before their own monitoring catches them.
Monitoring tells you something's wrong; observability tells you why. We instrument your systems with metrics, structured logging and tracing so that when something breaks, you can find the cause in minutes instead of guessing. Good observability turns a two-hour outage into a ten-minute one, and pays for itself the first time.
Monitoring. No incidents.
Payment service: database connection pool exhausted
Eliminating fragile snowflake servers, slow manual releases, brittle scripts, and coordination overhead across engineering teams.
Teams find out about issues from users before their own monitoring catches them.
Too many low-value alerts make it hard to notice the ones that matter.
When something breaks, response depends on whoever remembers what to do.
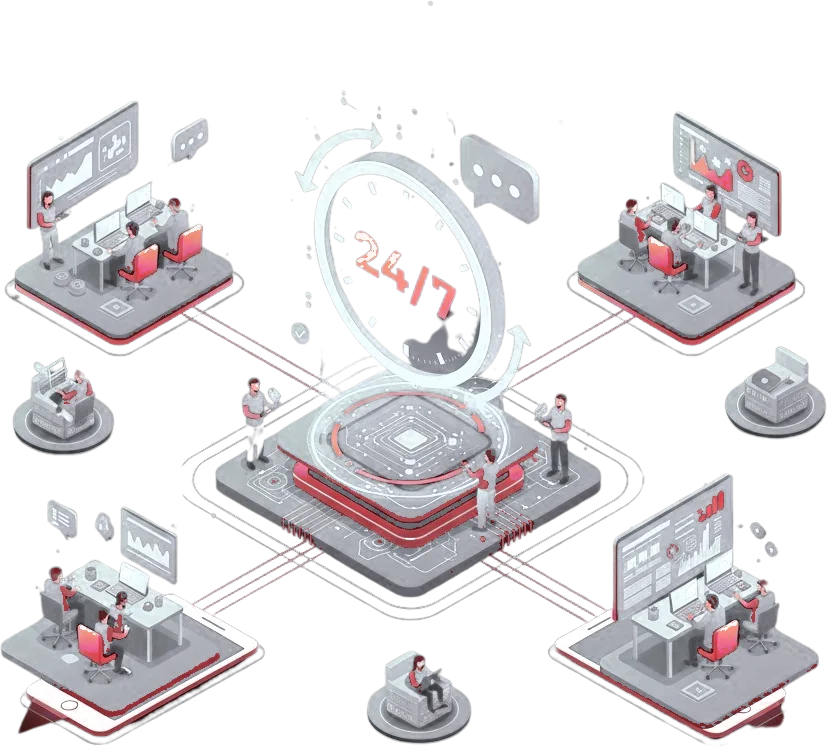
We instrument your systems with metrics, structured logging and tracing so that when something breaks, you can find the cause in minutes instead of guessing. Good observability turns a two-hour outage into a ten-minute one, and pays for itself the first time.
Decide what's actually worth watching before instrumenting everything.
Metrics, logs and traces brought together so incidents are diagnosed in minutes.
Alerts tuned to reduce noise so the ones that fire actually matter.
Documented response steps so an incident doesn't start with guesswork.
Architected around modular Infrastructure as Code, immutable container images, zero-trust network policies, and end-to-end telemetry.
Understand the business goal, current environment, risks and constraints before any design work begins.
Design the target operating model, controls and integration points so the solution fits how the business actually runs.
Build and configure the solution using repeatable, reviewed engineering practices, not one-off manual work.
Test against real scenarios and security requirements before anything reaches production.
Hand over documentation, runbooks and support so the client team can run the result with confidence.
Every phase ends with a documented deliverable and a clear go/no-go decision before the next one starts.
Standardizing Terraform modules, containerizing workloads with Kubernetes, automating release stages, and handing over runbooks.
Review what is monitored today and where the blind spots are.
Define what should be tracked and why, not just what is easy to collect.
Implement monitoring with tuned, actionable alert thresholds.
Write down response steps so they do not depend on one person's memory.
Ship features safely multiple times a day with automated rollback, standardized developer environments, and comprehensive telemetry.
Monitoring and tracing surface problems before users report them.
Alert thresholds are tuned so signals are worth acting on.
Response steps are written down instead of depending on institutional memory.
Production-proven open standards and cloud-native tools selected for maintainability, security, and developer ergonomics.
Practical guidance on container adoption, pipeline automation, and operational ownership.
Monitoring watches known signals; observability lets you investigate unknowns. You want both.
It can if unmanaged: we design what to collect so you get insight without a runaway bill.
Questions are not stored. Avoid sharing confidential information. Privacy Policy